vk-sessions
View/visualize the amount of time people spend online.
Usage
> vk-sessions -h
usage: vk-sessions [-h] [-g {user,date,weekday,hour}] [-i {csv,log,null}]
                   [-o {csv,json,plot}] [-a TIME_FROM] [-b TIME_TO]
                   [input] [output]
This script additionally requires matplotlib to be installed.
Analyze the database produced by vk-status and calculate the total amount of time people spent online. For example (assuming the database in "db.csv" was generated by vk-status before):
> vk-sessions db.csv
89497105,John,Smith,john.smith,0:12:31
3698577,Jane,Smith,jane.smith,1:34:46
In the example above, "John Smith" and "Jane Smith" spent approx. 13 and 95 minutes online respectively.
The output format is CSV (comma-separated values) by default. You can also get a JSON document:
> vk-sessions --output-format json db.csv
[
   {
      "uid": 89497105,
      "first_name": "John",
      "last_name": "Smith",
      "domain": "john.smith",
      "duration": "0:12:31"
   },
   {
      "uid": 3698577,
      "first_name": "Jane",
      "last_name": "Smith",
      "domain": "jane.smith",
      "duration": "1:34:46"
   }
]
The durations are calculated on a per-user basis by default.
You can change that by supplying either date (to group by dates), weekday
(to group by weekdays) or hour (to group by day hours) as the --group-by
parameter value.
For example (assuming that both Jane and Joe spent their time online on Friday,
June 17, 2016).
> vk-sessions --output-format json --group-by date db.csv
[
   {
      "date": "2016-06-17",
      "duration": "1:47:17"
   }
]
> vk-sessions --output-format csv --group-by weekday db.csv
Monday,0:00:00
Tuesday,0:00:00
Wednesday,0:00:00
Thursday,0:00:00
Friday,1:47:17
Saturday,0:00:00
Sunday,0:00:00
> vk-sessions --group-by hour db.csv
0:00:00,0:00:00
1:00:00,0:00:00
2:00:00,0:00:00
3:00:00,0:00:00
4:00:00,0:03:56
5:00:00,0:14:14
6:00:00,0:29:30
7:00:00,0:31:20
8:00:00,0:12:04
9:00:00,0:00:00
10:00:00,0:00:00
11:00:00,0:23:14
12:00:00,0:06:00
13:00:00,0:46:19
14:00:00,0:00:00
15:00:00,0:00:00
16:00:00,0:00:00
17:00:00,0:00:00
18:00:00,0:00:00
19:00:00,0:00:00
20:00:00,0:00:00
21:00:00,0:00:00
22:00:00,0:00:00
23:00:00,0:00:00
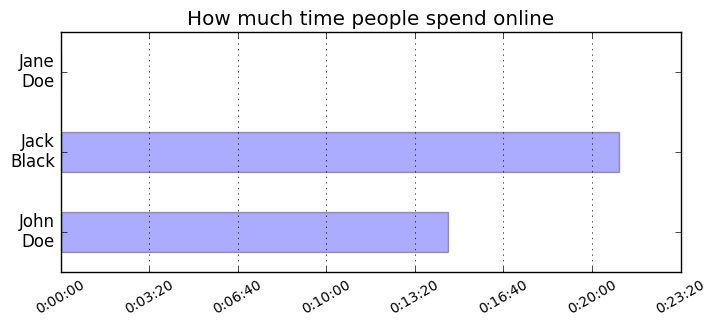
In my opinion, the script's most useful feature is its ability to easily create
plots that represent this data (like in the examples above).
To produce a plot, pass plot as the --output-format parameter value and add
a file path to write the image to.
> vk-sessions --output-format plot db.csv user.png
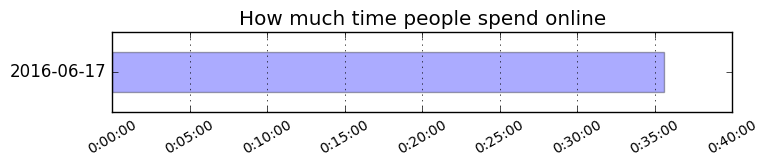
> vk-sessions --output-format plot --group-by date db.csv date.png
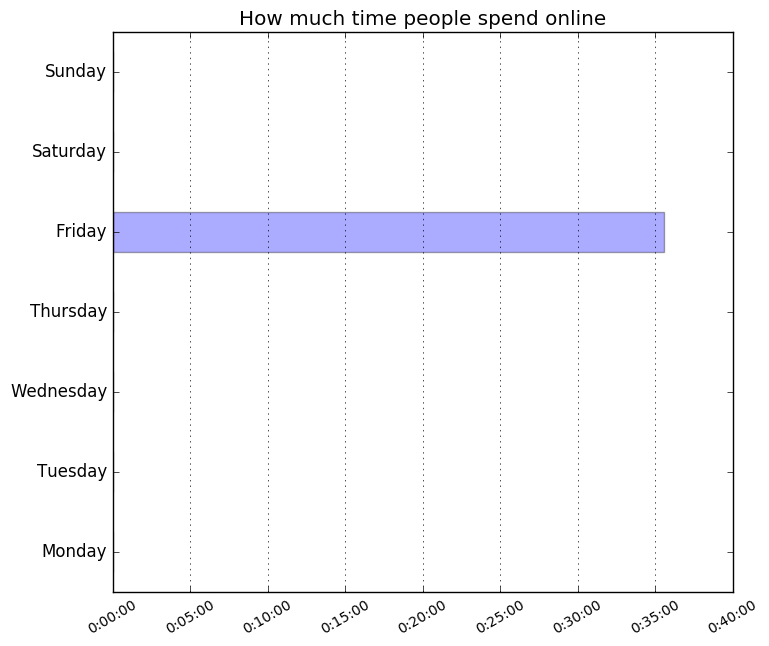
> vk-sessions --output-format plot --group-by weekday db.csv weekday.png
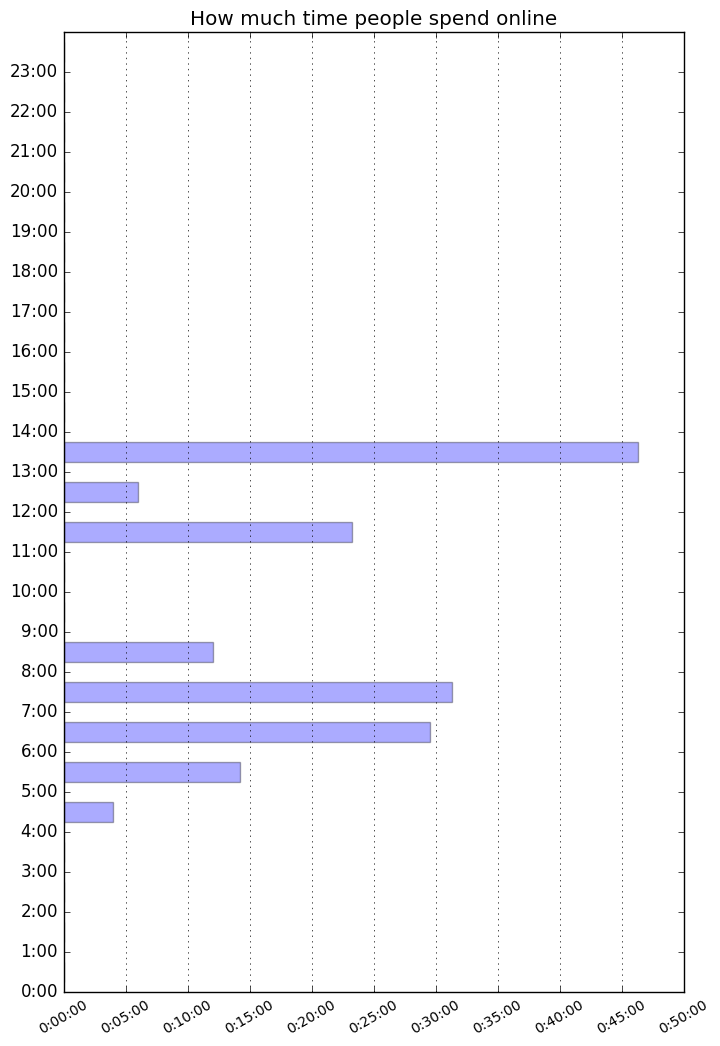
> vk-sessions --output-format plot --group-by hour db.csv hour.png
You can limit the scope of the database by supplying a time range.
Only online sessions that overlap with this range shall then be processed.
Set the range by specifying both or one of the --from and --to parameters.
The values must be in the %Y-%m-%dT%H:%M:%SZ format (a subset of ISO 8601).
All dates and times are in UTC.
Known issues
- When people go online using the web version and don't visit other pages over time (for example, just listening to music), they appear offline. Hence the 0:00:00 durations you might sometimes encounter. This might also happen using other clients.